
Unraveling the Mystery of Population Density: A Core Concept in Ecology
Imagine a bustling city street during rush hour, packed with people, cars, and noise. Now picture a vast, silent desert, where you might walk for miles without seeing another living soul. The stark difference between these two scenes perfectly encapsulates a fundamental concept in ecology: population density. It is more than just a number; it is a powerful indicator of how life interacts with its environment, influencing everything from resource availability to the spread of disease. Understanding population density is crucial for ecologists, urban planners, conservationists, and anyone curious about the intricate balance of life on Earth.
What is Population Density?
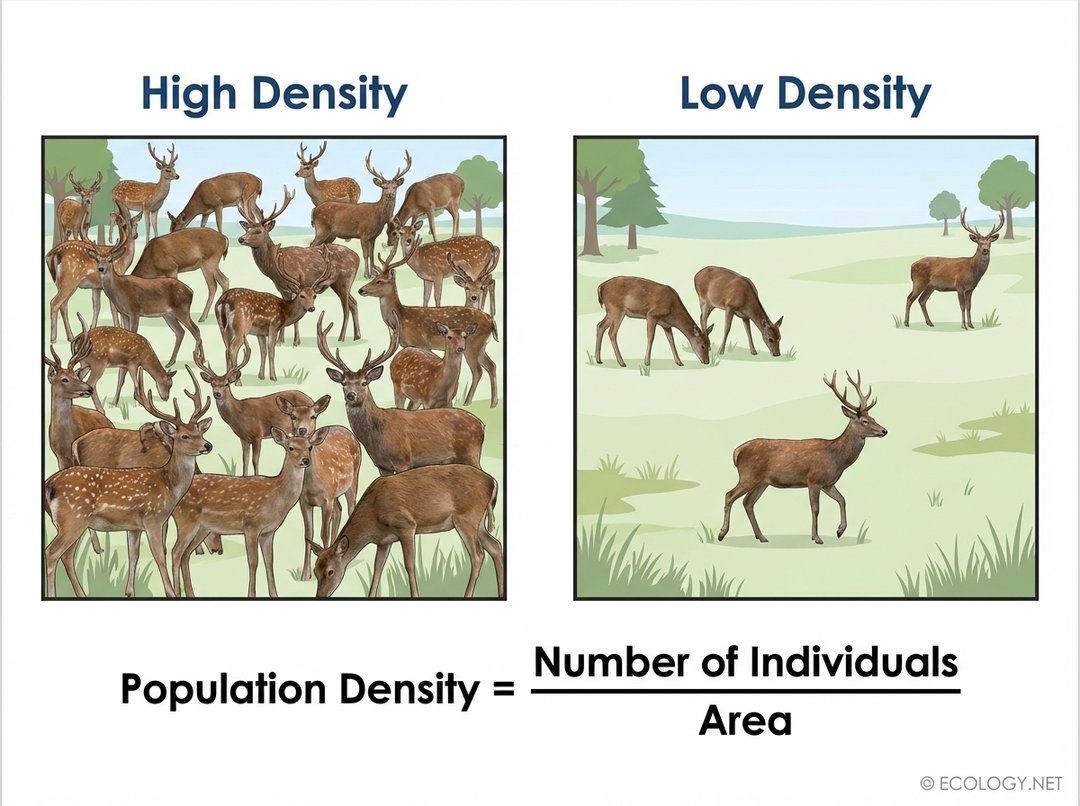
At its heart, population density is a measure of how many individuals of a particular species live within a given area or volume. It tells us how crowded or sparse a population is. Whether we are talking about a forest of oak trees, a school of fish in the ocean, a colony of ants, or the human population of a metropolis, density provides a snapshot of spatial distribution.
Consider a herd of deer. If 100 deer live in a 10-square-kilometer forest, their population density is 10 deer per square kilometer. If those same 100 deer were confined to a 1-square-kilometer enclosure, their density would skyrocket to 100 deer per square kilometer. This simple comparison highlights how the same number of individuals can have vastly different densities depending on the space they occupy.
Calculating Population Density
The calculation of population density is straightforward, relying on a simple mathematical formula:
Population Density = Number of Individuals / Area
To apply this formula, two key pieces of information are needed:
- Number of Individuals: This refers to the total count of the species within the defined space. For some species, like large mammals, direct counting might be feasible. For others, like insects or microscopic organisms, sampling methods are used to estimate the total.
- Area (or Volume): This is the specific geographic space or three-dimensional volume where the population resides. The units for area can vary widely, from square meters (m²) for small plots to square kilometers (km²) or square miles (mi²) for larger regions. For aquatic or aerial species, volume (e.g., cubic meters, m³) might be more appropriate.
For example, if a wildlife biologist counts 250 wild horses in a national park that spans 500 square kilometers, the population density is:
250 horses / 500 km² = 0.5 horses per km²
This means, on average, there is half a wild horse for every square kilometer of the park.
Why Does Population Density Matter?
Understanding population density is far more than an academic exercise; it has profound implications for the survival and dynamics of a species and the health of an ecosystem.
- Resource Competition: High population density often leads to increased competition for essential resources like food, water, shelter, and mates. When resources are scarce, a dense population can experience higher mortality rates or reduced reproductive success.
- Disease Transmission: In crowded populations, diseases can spread much more rapidly. Close proximity facilitates the transmission of pathogens, potentially leading to epidemics that can decimate a population.
- Predator-Prey Dynamics: The density of prey species can directly influence the density of their predators. A high density of prey might attract more predators, leading to increased predation pressure. Conversely, a low prey density might force predators to seek alternative food sources or face starvation.
- Social Behavior: For social species, density can affect group dynamics. Overcrowding can lead to stress, aggression, and a breakdown of social structures, while very low densities might make it difficult to find mates or form protective groups.
- Environmental Impact: Dense populations can exert greater pressure on their environment, leading to habitat degradation, overgrazing, or depletion of local resources. This is particularly evident in human populations, where high urban densities require extensive infrastructure and resource management.
Factors Influencing Population Density
Population density is not static; it is a dynamic measure constantly shifting due to a combination of factors:
- Birth Rate (Natality): The number of new individuals born into a population over a specific period. A higher birth rate increases density.
- Death Rate (Mortality): The number of individuals that die within a population over a specific period. A higher death rate decreases density.
- Immigration: The influx of individuals from other populations into the area. Immigration increases density.
- Emigration: The outflow of individuals from the population to other areas. Emigration decreases density.
- Environmental Factors: Availability of food, water, shelter, climate conditions, presence of predators, and disease all play a significant role in influencing birth and death rates, and thus, density.
Types of Population Distribution
While density tells us how many individuals are in an area, population distribution describes how those individuals are spatially arranged within that area. There are three primary patterns of distribution, each revealing insights into the species’ biology and its interactions with the environment.
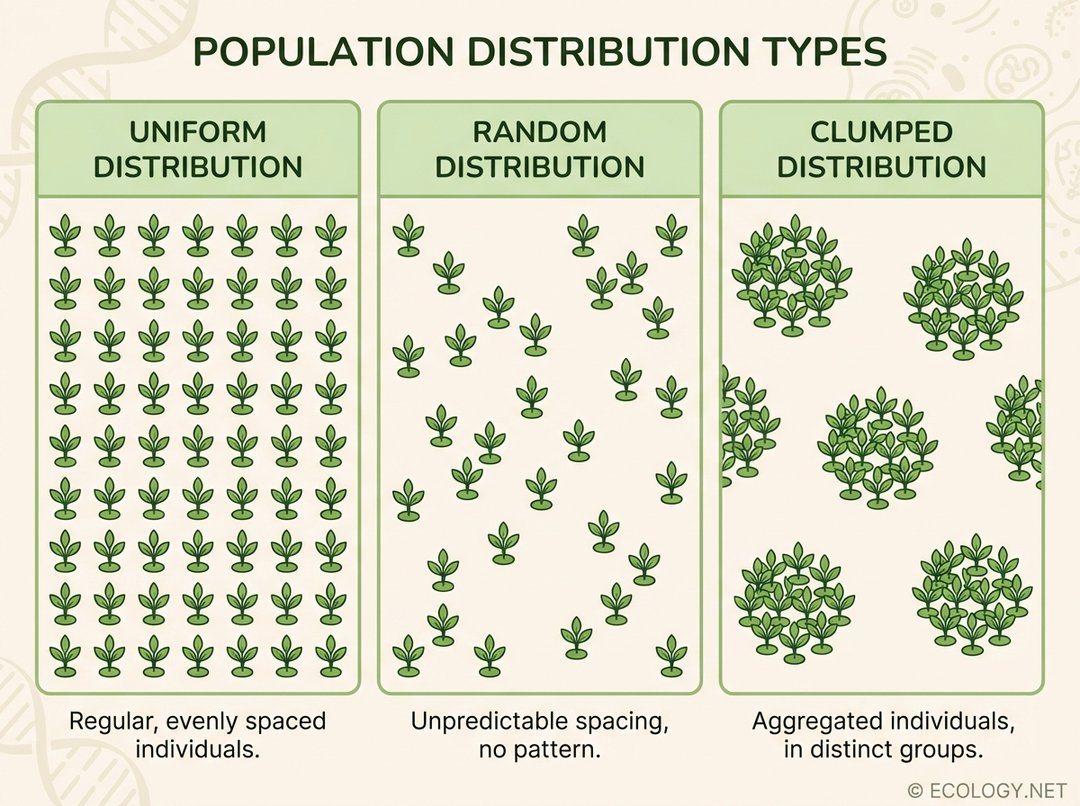
Uniform Distribution
In a uniform distribution, individuals are spaced out relatively evenly across the habitat. This pattern often arises when there is intense competition for resources, or when individuals exhibit territoriality, actively defending their space from others. Think of:
- Trees in an orchard, planted at regular intervals by humans.
- Creosote bushes in a desert, which release toxins to inhibit the growth of nearby plants, ensuring their own access to scarce water.
- Penguins on a breeding ground, maintaining a consistent distance from their neighbors to protect their nests.
Random Distribution
Random distribution occurs when the position of each individual is independent of the others. This pattern is less common in nature and usually suggests that resources are uniformly available, and there are no strong attractions or repulsions between individuals. Examples include:
- Dandelions in a field, where their wind-dispersed seeds land and grow haphazardly.
- Some species of forest trees, where seed dispersal and germination are largely random events.
Clumped Distribution
Clumped distribution, also known as aggregated distribution, is the most common pattern observed in nature. Individuals are grouped together in patches. This clustering can be due to:
- Resource availability: Individuals gather where resources like food, water, or shelter are concentrated. For instance, animals might congregate around a waterhole in a dry savanna.
- Social behavior: Many species form groups for protection, hunting, or mating. Examples include wolf packs, schools of fish, herds of elephants, or human cities.
- Reproductive strategies: Plants that reproduce vegetatively or have limited seed dispersal often show clumped patterns, with offspring growing close to the parent plant.
The distribution pattern of a population offers a deeper understanding than density alone, revealing the underlying ecological forces at play.
Beyond Simple Density: Carrying Capacity and Population Growth
Population density is not a static number; it is constantly changing. Populations grow, shrink, and stabilize over time. These dynamics are heavily influenced by the concept of carrying capacity, a critical ecological limit.
Exponential Growth
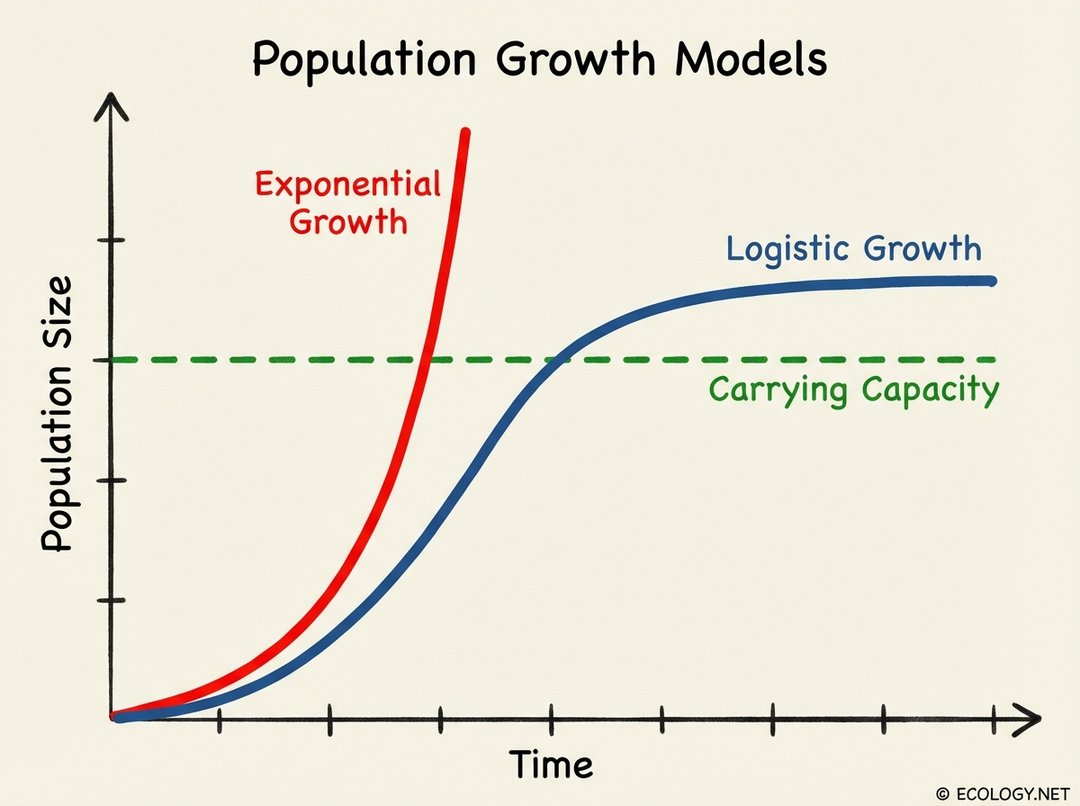
When resources are abundant and there are no limiting factors, a population can experience exponential growth. This is characterized by a rapid, accelerating increase in population size, often depicted as a J-shaped curve on a graph. Imagine a bacterial colony in a petri dish with unlimited nutrients; it will multiply at an astonishing rate. However, exponential growth cannot continue indefinitely in the real world.
Logistic Growth and Carrying Capacity
In reality, environments have finite resources. As a population grows, it eventually encounters limiting factors such as food scarcity, lack of space, increased predation, or disease. These factors slow down the growth rate, leading to logistic growth, which is represented by an S-shaped curve. The population initially grows exponentially, but then its growth rate slows as it approaches the environment’s carrying capacity (K).
Carrying capacity is the maximum population size of a biological species that can be sustained indefinitely by a given environment, given the available food, habitat, water, and other necessities. When a population reaches its carrying capacity, its birth rate equals its death rate, and the population size stabilizes. If a population overshoots its carrying capacity, it can degrade its environment, leading to a sharp decline in population size until the environment can recover or a new, lower carrying capacity is established.
Factors that limit population growth and determine carrying capacity are often categorized as:
- Density-dependent factors: These factors have a greater impact as population density increases. Examples include competition for resources, predation, disease, and waste accumulation.
- Density-independent factors: These factors affect a population regardless of its density. Examples include natural disasters like floods, fires, extreme weather events, or pollution.
Real-World Examples and Practical Insights
The principles of population density, distribution, and carrying capacity are not just theoretical constructs; they are vital for understanding and managing our world.
- Human Population Density: The vast differences in human population density, from the crowded streets of Tokyo to the sparsely populated Australian outback, highlight challenges in urban planning, resource allocation, and infrastructure development. Understanding these densities helps cities plan for housing, transportation, and public services.
- Wildlife Management: Conservation efforts often hinge on understanding population density. For endangered species, low densities can make finding mates difficult, while for overabundant species, high densities can lead to habitat destruction and conflict with human interests, as seen with deer populations in suburban areas.
- Agriculture: Farmers strategically manage plant density in their fields to optimize crop yield. Too dense, and plants compete for light and nutrients; too sparse, and land is underutilized.
- Disease Ecology: The density of host populations is a critical factor in the spread of infectious diseases. For example, understanding the density of mosquito populations is key to controlling malaria outbreaks.
- Marine Biology: Fish schools, a classic example of clumped distribution, benefit from safety in numbers against predators. However, overfishing can drastically reduce the density of these schools, impacting their survival and the entire marine food web.
Conclusion
Population density is a cornerstone of ecological understanding, offering a window into the intricate relationships between organisms and their environment. From the simple count of individuals in a space to the complex dynamics of growth and carrying capacity, this concept helps us decipher the patterns of life on Earth. By appreciating how density shapes competition, disease, social interactions, and environmental impact, we gain invaluable insights for conservation, sustainable resource management, and navigating the challenges of a changing world. It is a reminder that every living thing, from the smallest microbe to the largest whale, is part of a delicate balance, where space and numbers tell a profound story.


