
Unveiling Earth’s Carbon Balance: Understanding Net Ecosystem Productivity
Imagine our planet’s ecosystems as vast, living breathers, constantly inhaling and exhaling carbon dioxide. Some ecosystems are powerful carbon sponges, drawing vast amounts of this greenhouse gas from the atmosphere, while others release it. Understanding this delicate balance is crucial for comprehending our climate and the health of our natural world. At the heart of this understanding lies a fundamental ecological metric: Net Ecosystem Productivity, or NEP.
NEP is more than just an ecological term; it is a vital indicator, a global thermometer for how well ecosystems are managing their carbon budget. It tells us whether a forest, a grassland, or even a wetland is acting as a net carbon sink, storing carbon, or a net carbon source, releasing it. This concept is indispensable for scientists, policymakers, and anyone interested in the intricate dance between life and the atmosphere.
What Exactly is Net Ecosystem Productivity (NEP)?
At its core, Net Ecosystem Productivity represents the net accumulation or loss of carbon within an entire ecosystem over a specific period. Think of it as the ecosystem’s ultimate carbon bank account balance. If the balance is positive, the ecosystem is accumulating carbon; if it is negative, it is losing carbon to the atmosphere.
NEP is derived from two primary, opposing processes:
- Gross Primary Production (GPP): The total amount of carbon fixed by all photosynthetic organisms (plants, algae, some bacteria) in an ecosystem. This is the “income” side of the carbon budget, representing all the carbon dioxide absorbed from the atmosphere and converted into organic matter.
- Ecosystem Respiration (ER): The total amount of carbon dioxide released back into the atmosphere by all living organisms within the ecosystem. This includes respiration from plants (autotrophic respiration), animals, and crucially, microbes in the soil (heterotrophic respiration). This is the “expenditure” side of the carbon budget.
The relationship is straightforward:
NEP = GPP – ER
A positive NEP means GPP is greater than ER, indicating the ecosystem is a carbon sink. A negative NEP means ER is greater than GPP, indicating the ecosystem is a carbon source.
The Components of NEP Explained
Gross Primary Production (GPP): The Carbon Income
GPP is the engine of carbon capture. It is the raw power of photosynthesis at work across an entire ecosystem. Factors that boost photosynthesis will naturally increase GPP. These include:
- Sunlight: Abundant light provides the energy for photosynthesis.
- Water: Essential for plant growth and the photosynthetic process.
- Nutrients: Nitrogen, phosphorus, and other elements are vital building blocks for plant tissues.
- Temperature: Optimal temperatures allow enzymes involved in photosynthesis to function efficiently.
- Plant Biomass and Type: Ecosystems with high leaf area and fast-growing species generally have higher GPP.
Ecosystem Respiration (ER): The Carbon Expenditure
ER is the sum of all metabolic activity that releases carbon dioxide. It is a complex aggregate of:
- Autotrophic Respiration (Ra): The CO2 released by plants themselves as they grow, maintain their tissues, and carry out their life processes.
- Heterotrophic Respiration (Rh): The CO2 released by all other organisms, primarily decomposers like bacteria and fungi breaking down dead organic matter in the soil, but also animals consuming plant material.
Factors influencing ER include:
- Temperature: Higher temperatures generally increase metabolic rates, leading to more respiration.
- Moisture: Soil moisture can influence microbial activity; too dry or too wet can inhibit it.
- Substrate Availability: The amount of organic matter available for decomposers directly impacts Rh.
Why NEP Matters: A Global Carbon Thermometer
NEP is far more than an academic curiosity; it is a critical metric with profound implications for global climate. When an ecosystem has a strongly positive NEP, it is actively removing carbon dioxide from the atmosphere and storing it in its biomass (trees, roots) and soils. This makes it a valuable “carbon sink,” helping to mitigate the rise of atmospheric CO2 concentrations and, by extension, global warming.
Conversely, if an ecosystem’s NEP becomes negative, it means it is releasing more carbon than it is absorbing, becoming a “carbon source.” This can happen due to disturbances like wildfires, deforestation, or prolonged droughts, which can kill vegetation and accelerate the decomposition of organic matter. Understanding these shifts is vital for predicting future climate scenarios and developing effective conservation strategies.
Factors Influencing NEP: A Dynamic Balance
The NEP of an ecosystem is not static; it is a dynamic balance influenced by a myriad of factors, from the inherent characteristics of the biome to seasonal changes and human activities.
Ecosystem Type: Tropical vs. Boreal Forests
Different types of ecosystems exhibit vastly different NEPs due to their unique environmental conditions and biological communities.
- Tropical Rainforests: These lush, warm, and wet environments boast incredibly high GPP due to year-round growing seasons, abundant sunlight, and high biodiversity. While ER is also high due to rapid decomposition and plant respiration, GPP typically far outstrips it, resulting in a strongly positive NEP. Tropical rainforests are among the most powerful carbon sinks on Earth.
- Boreal Forests: Found in colder, northern latitudes, boreal forests are dominated by conifers. Their GPP is lower than tropical forests due to shorter growing seasons and colder temperatures. ER is also lower because decomposition is slower in cold soils. While still generally positive, the NEP of boreal forests is more modest compared to their tropical counterparts.
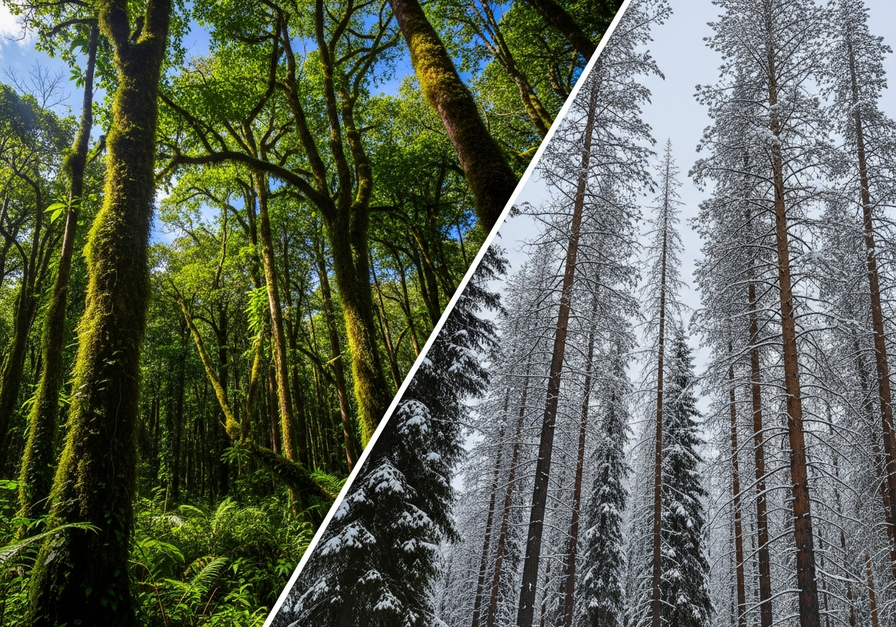
This split-screen image vividly illustrates the contrast between a tropical rainforest and a boreal forest. The dense, vibrant growth of the tropical forest on the left signifies its high Gross Primary Production (GPP), leading to a strongly positive Net Ecosystem Productivity (NEP). On the right, the more sparse, snow-dusted boreal forest, with its tall conifers, represents an ecosystem with lower GPP and a more modest, though still positive, NEP. This visual comparison highlights how different biomes contribute uniquely to the global carbon balance.
Seasonal Variations: The Temperate Dance
In many ecosystems, NEP fluctuates dramatically with the seasons. Temperate deciduous forests provide an excellent example:
- Spring and Summer: As leaves emerge and grow, photosynthesis kicks into high gear, leading to very high GPP. While respiration is also active, GPP significantly outweighs it, making these forests strong carbon sinks.
- Autumn: As leaves senesce and fall, GPP declines sharply.
- Winter: With bare branches and often frozen ground, GPP is minimal or zero. However, respiration from soil microbes and plant maintenance continues, albeit at a reduced rate. During this period, ER can exceed GPP, causing the ecosystem to become a net carbon source (negative NEP).
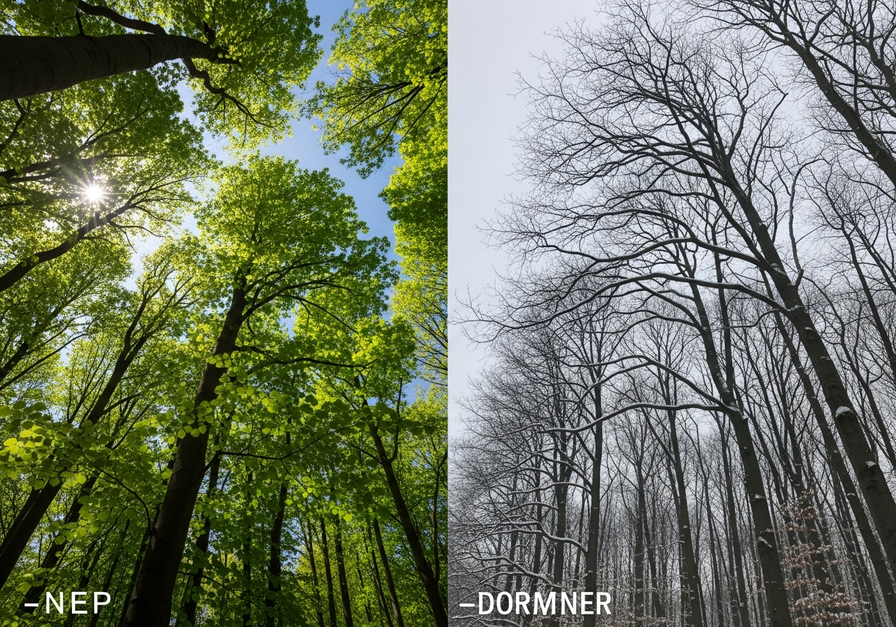
This split-screen photograph captures a temperate deciduous forest in two distinct seasons. On the left, the forest bursts with bright green leaves in spring, signifying peak photosynthetic activity and a strongly positive Net Ecosystem Productivity (NEP). The right side shows the same forest in late winter, with bare branches and scattered snow, indicating minimal carbon uptake and potentially a negative NEP as respiration may exceed the limited Gross Primary Production. This visual emphasizes the dramatic seasonal swings in carbon balance for these ecosystems.
Environmental Conditions: Climate and Disturbances
Beyond biome type and seasonality, day-to-day and year-to-year environmental conditions play a huge role:
- Temperature and Precipitation: Extreme heat, drought, or excessive rainfall can stress plants, reduce GPP, and alter respiration rates.
- CO2 Concentration: Elevated atmospheric CO2 can sometimes “fertilize” plants, increasing GPP, though this effect is complex and varies by species and nutrient availability.
- Nutrient Availability: Limited nutrients can constrain plant growth and thus GPP.
- Disturbances: Events like wildfires, insect outbreaks, or severe storms can drastically shift an ecosystem from a carbon sink to a carbon source by killing vegetation and accelerating decomposition.
Human Impact: Land Use Change
Human activities, particularly land use changes, have a profound impact on NEP. Deforestation, for instance, immediately reduces GPP and can release vast amounts of stored carbon through burning or decomposition, turning a powerful carbon sink into a significant carbon source. Agricultural practices, urbanization, and wetland drainage also alter the carbon balance of landscapes.
Measuring the Invisible: How Ecologists Quantify NEP
Quantifying NEP across vast and complex ecosystems is a significant challenge, but ecologists have developed sophisticated methods to do so.
Eddy Covariance: The Direct Approach
One of the most powerful and widely used methods is the eddy covariance technique. This method involves setting up tall towers equipped with highly sensitive sensors above the ecosystem canopy. These sensors continuously measure the rapid, turbulent fluctuations of carbon dioxide, water vapor, and heat moving between the ecosystem and the atmosphere.
By analyzing these “eddies” of air, scientists can directly calculate the net exchange of CO2, providing real-time measurements of NEP over an area ranging from hundreds of square meters to several square kilometers. This technique offers invaluable insights into how ecosystems respond to daily and seasonal changes, as well as longer-term climate shifts.
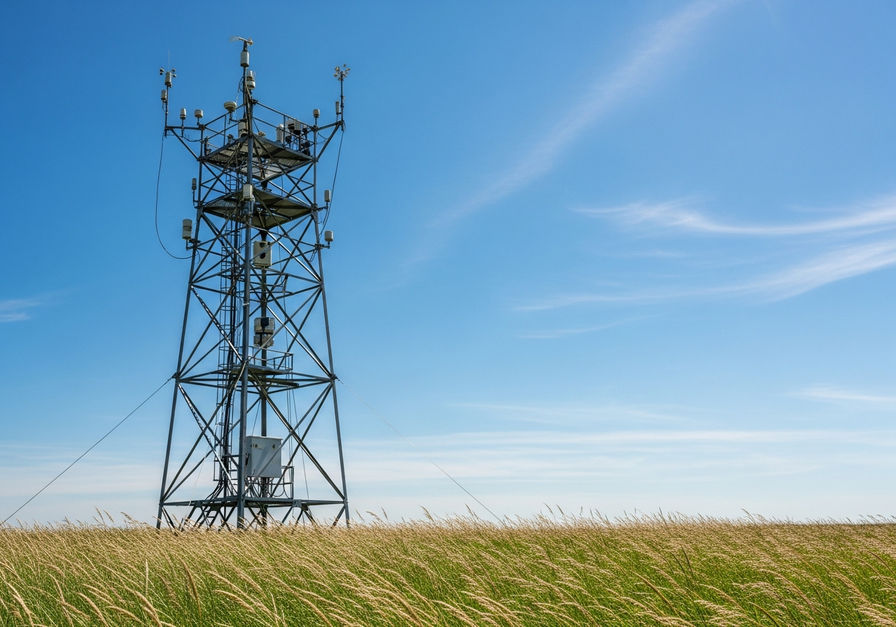
This photograph shows an eddy covariance tower standing prominently in a grassy field under a clear blue sky. The tower, equipped with various sensors, is a crucial tool for ecologists. It directly measures the exchange of carbon dioxide and water vapor between the ecosystem and the atmosphere, providing real-time data to calculate Net Ecosystem Productivity. This method allows scientists to understand how ecosystems function as carbon sinks or sources in their natural environment.
Chamber Methods and Remote Sensing
While eddy covariance provides ecosystem-scale measurements, other methods offer complementary data:
- Chamber Methods: Small, portable chambers are placed over specific plants or soil patches to measure CO2 flux at a very fine scale. These are excellent for understanding specific processes like soil respiration or individual plant photosynthesis.
- Remote Sensing: Satellites and airborne sensors can estimate GPP over vast regions by measuring vegetation greenness and other spectral properties. These data are then combined with models to infer NEP at regional and global scales.
Modeling and Upscaling
The data collected from eddy covariance towers, chambers, and remote sensing are integrated into complex ecosystem models. These models help scientists understand the underlying processes driving NEP, predict how ecosystems might respond to future climate change, and upscale local measurements to continental and global estimates of carbon balance.
NEP in a Changing World: Challenges and Future Outlook
The concept of Net Ecosystem Productivity has never been more relevant than it is today. As global temperatures rise, precipitation patterns shift, and extreme weather events become more frequent, understanding how these changes impact NEP is paramount.
- Climate Change Impacts: Warming temperatures can increase both GPP (in some cases, by extending growing seasons) and ER (by accelerating decomposition). The net effect on NEP is complex and varies by ecosystem. Droughts can severely reduce GPP, leading to negative NEP.
- Feedback Loops: Changes in NEP create feedback loops with the climate. If ecosystems become less efficient carbon sinks or even turn into carbon sources, they accelerate the accumulation of CO2 in the atmosphere, further exacerbating climate change.
- Ecosystem Resilience: A stable, positive NEP is often an indicator of a healthy, resilient ecosystem. Monitoring NEP helps scientists assess the vulnerability of ecosystems to environmental stressors and the effectiveness of conservation and restoration efforts.
Future research will continue to refine our understanding of NEP, particularly in understudied regions and in response to novel environmental conditions. This knowledge is crucial for informing climate policy, guiding land management decisions, and ultimately, safeguarding the planet’s vital carbon balance.
Conclusion
Net Ecosystem Productivity is a powerful and comprehensive metric that encapsulates the dynamic carbon exchange between life on Earth and its atmosphere. It is a testament to the intricate workings of our planet’s ecosystems, revealing their capacity to act as critical buffers against climate change. By continuously monitoring and understanding NEP, we gain invaluable insights into the health of our natural world and equip ourselves with the knowledge needed to foster a more sustainable future for all.


